When I first started telling people I was learning data analytics, the responses were all over the place. Some people thought I was learning to code apps. Some thought I was training machine learning models. Some thought I was basically doing advanced Excel.
None of those are exactly wrong, but none of them are quite right either.
So this post is a clear, practical explanation of what data analytics actually is, what it is not, and what the work really looks like when you move past buzzwords and into real systems, real data, and real decisions.
The Core Definition
At its core, data analytics is the discipline of transforming raw data into structured, reliable information that people can use to make better decisions.
That sounds simple, but in practice it involves multiple layers of technical and conceptual work:
- Identifying the business or product question
- Translating that question into measurable definitions
- Locating the correct data sources
- Cleaning, validating, and transforming that data
- Structuring it into a usable model
- Performing analysis on top of that model
- Communicating the results clearly and honestly
Analytics is not one tool or one step. It is a workflow.
Step 1: Framing the Right Question
Everything starts with the question. Not “what data do we have,” but “what are we trying to understand or decide.”
For example:
- Why did retention drop last month?
- Which customer segment is most profitable?
- Which feature correlates with long-term engagement?
- Where in the funnel are users dropping off?
A vague question produces vague analysis. A precise question forces you to define what matters.
This is where analytics overlaps heavily with product management, strategy, and operations.
Step 2: Defining Metrics and Concepts
Before touching any data, you have to define what your metrics actually mean.
What is an “active user”?
What counts as a “conversion”?
What defines “retention”?
What is a “session,” an “event,” or a “transaction”?
These definitions shape your entire analysis.
Two teams can look at the same data and reach opposite conclusions simply because they defined the metrics differently.
This is one of the most underrated but most important parts of analytics.
Step 3: Collecting and Understanding the Data
Next, you identify where the data lives.
This could be:
- Application databases
- Event tracking platforms
- CRM systems
- Financial systems
- Log files
- Third-party APIs
You need to understand:
- What tables exist
- What each field represents
- How tables relate to each other
- What is missing, delayed, or unreliable
This is where SQL and data exploration become essential.
Step 4: Cleaning and Transforming
Raw data is almost never ready for analysis.
Common issues include:
- Missing values
- Duplicates
- Inconsistent formats
- Incorrect timestamps
- Misaligned keys
- Partial records
You typically use SQL, Python, or transformation tools to:
- Remove or flag bad records
- Normalize formats
- Join datasets correctly
- Create derived fields
- Aggregate to the correct grain
This step is where most analytics work actually happens.
Step 5: Data Modeling
Once the data is clean, you structure it into a model that supports analysis.
This usually means:
- Separating fact tables and dimension tables
- Defining primary and foreign keys
- Choosing appropriate levels of aggregation
- Avoiding duplication and ambiguity
A good model makes analysis easy and consistent.
A bad model creates confusion, contradictions, and errors.
This is why understanding star schemas, normalization, and data relationships matters so much.
Step 6: Analysis
Now you finally analyze.
This might involve:
- Trend analysis
- Segmentation
- Cohort analysis
- Funnel analysis
- Correlation analysis
- Outlier detection
The goal is not to find patterns, but to find meaningful patterns that relate back to the original question.
This is where tools like SQL, Python, Power BI, Tableau, or Looker come into play.
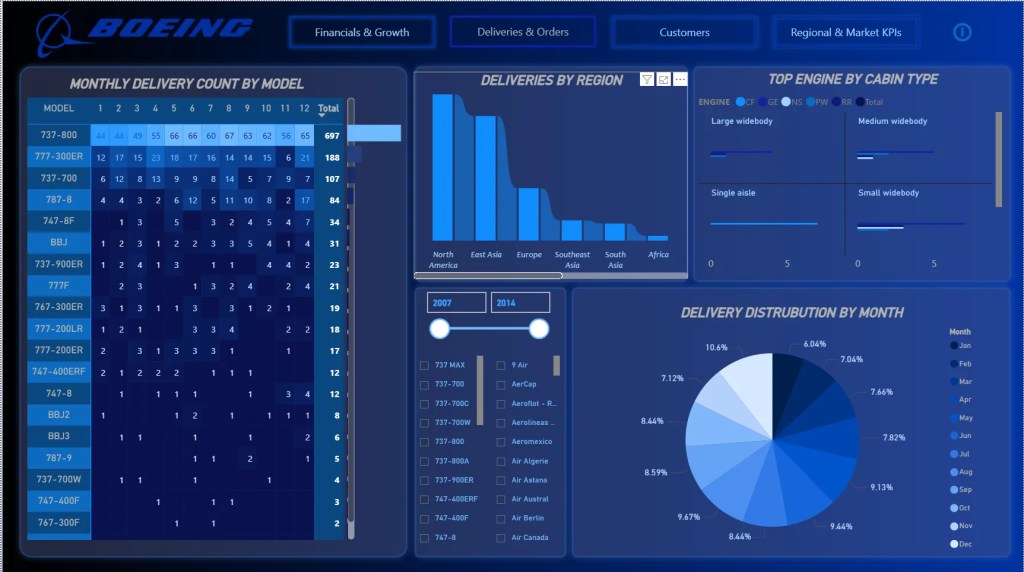
Step 7: Visualization and Communication
Finally, you present the results.
But this is not about making something look pretty.
It is about:
- Choosing the right chart for the message
- Ordering information logically
- Highlighting what matters
- Providing context and caveats
- Avoiding misleading visuals
The purpose is clarity, not decoration.
What Data Analytics Is Not
It is not just building dashboards.
It is not just writing queries.
It is not just collecting data.
It is not just making charts.
Those are tools. Analytics is the thinking that connects them.
The Difference Between Analytics, Data Science, and Engineering
- Data engineering builds the infrastructure and pipelines.
- Data science builds predictive and experimental models.
- Data analytics interprets data to inform decisions.
All are important. They simply serve different purposes.
Why Analytics Requires Judgement
Analytics is not objective truth. It is structured interpretation.
Every choice you make influences the outcome:
- What you measure
- What you exclude
- How you aggregate
- How you visualize
This is why ethics, transparency, and humility matter in analytics.
Bad analytics is worse than no analytics, because it creates false confidence.
Final Thoughts
Data analytics is not magic. It does not replace human judgment. It supports it.
It is a way of seeing systems more clearly, understanding behavior more deeply, and making decisions with less guesswork and more evidence.
That combination of technical rigor and human context is what makes analytics powerful.


Leave a comment